Search
Evaluate Costs and Benefits
Well-designed ID systems have the potential to advance multiple development goals and create fiscal savings for governments by increasing administrative efficiency, reducing fraud, and improving taxation. However, they also require a significant investment. The specific cost drivers in a given context are a function of inherent country characteristics as well as the overall system design. Understanding the cost implications—and potential fiscal benefits—of different components of the ID system will help practitioners make smart investments in vital areas while avoiding expensive solutions that may not serve the country’s ultimate goals or needs.
As part of the planning process, practitioners should make a complete cost-benefit analysis (CBA) of different technical and implementation options. This includes modeling costs for ID system features and roll-out strategies, as well as identifying potential fiscal and non-fiscal benefits to the government, private sector and individuals. ID4D has developed several tools to assist with this process, including:
- A toolkit that explains cost drivers and a costing model (Excel)
- A framework for estimating potential fiscal saving for the public sector
- A framework for estimating potential savings for the private sector and broader economy
1. Estimate cost implications of ID systems
Using data from 15 countries at various levels of development and with diverse ID ecosystems, the ID4D costing study identified six key categories that together make up 90 percent of the typical cost of ID systems: (1) human resources, (2) credentials, (3) central IT infrastructure, (4) physical establishments, (5) registration infrastructure, and (6) information and education campaigns (IECs) (see Figure 8).
Figure 8. Major cost categories for ID systems
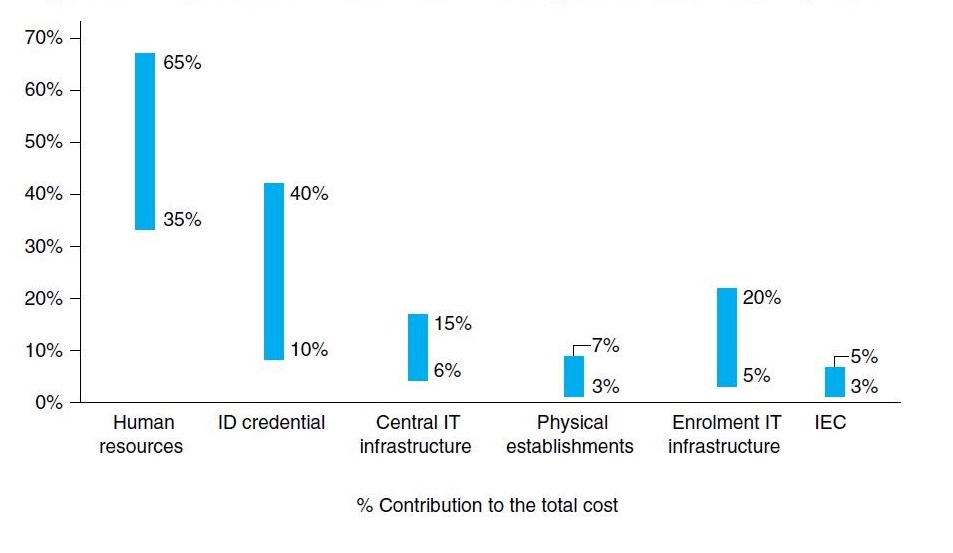
Source: Understanding Cost Drivers of Identification Systems
As shown in Figure 9, the major drivers that determine expenses within these categories include country characteristics and design choices. For system design, the highest impact drivers are related to many of the key decisions discussed above, including:
- Registration timeline: Countries with shorter timeframes (~2 years) experienced higher costs due to the personnel and equipment required to enroll large portions of the population simultaneously in a short amount of time. Countries with a longer time frame (~3-6 years) had a lower and more uniform distribution of costs.
- Choice of biometrics: Each additional multimodal biometric modality captured (i.e., fingerprints, facial image, iris scans) increased cost by approximately 5-10 percent; however multimodal biometrics also increase accuracy and inclusion compared with single modality approaches.
- Number of biographic fields: The number of data fields captured determines the time to collect, digitize, and proof identities, and its associated human resource costs. Furthermore, the more semi-static data collected during (e.g., address, email), the more time and resources will be spent in the future on updating this data.
- Choice of credential form factor: Physical credentials (i.e., cards) have the highest variation in cost, with estimated expenses between 10 to 40 percent of the total project costs. The low end of the cost spectrum includes very basic ID cards with the capacity for online authentication, while the higher costs are associated with multi-purpose smartcards.
- Integration between CR and ID: Countries where CR and ID systems were closely integrated—e.g., through a unique ID number (UIN) issued at birth and shared administration—had substantial savings in both the start-up and steady-state phases of the project.
In addition to these design choices, the study also identified procurement practices as a major potential cost inflator.
Figure 9. Cost categories and drivers for ID systems
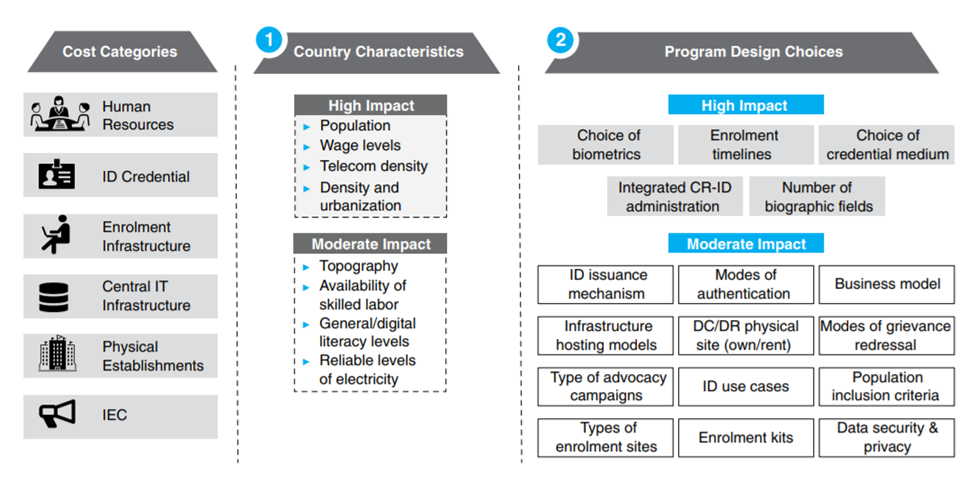
Source: Understanding Cost Drivers of Identification Systems
In addition to design choices, many of the same country characteristics that influence design decisions will also influence costs. The highest-impact characteristics include:
- Population size: Countries with a larger eligible population often require a greater investment to adequately meet the enrollment targets and timelines for the ID program. At the same time, a larger population could also result in reduction of program cost per person (e.g. central infrastructure costs) due to economies of scale.
- Density and urbanization: High urbanization levels and population density have a considerable impact on the distribution of human resources, registration centers and kits for the program. Countries will have to deploy more program resources towards urban centers than to rural centers, but the marginal cost of reaching an additional person is typically lower than in remote areas.
- Labor and wage levels: Human resources (e.g. program staff for central administration, enrollment and resident engagement) are one of the major drivers of ID system cost. Therefore, the prevalent wage levels in the country will have a significant impact on the operating cost, across both during the start-up phase and steady state of the ID program.
- Digital infrastructure: Existing ICT infrastructure influences design choices (e.g., credential types and online authentication mechanisms) that drive the cost of the overall program. In addition, lack of infrastructure at registration stations that limits the ability to securely enter and transfer data will lengthen the timeline, also potentially inflating costs. The need to connect remote centers (e.g., via wired or wireless connections) will significantly increase cost. Finally, the extent to which capacity building is required (e.g., for cybersecurity protections) also needs to be considered.
2. Determine opportunities for savings
In addition to the cost of specific design choices, practitioners should also consider their potential fiscal benefits. A pair of ID4D publications create a framework for estimating these potential benefits across sectors (see Public Sector Savings and Revenue from Identification Systems and Private Sector Economic Impacts from Identification Systems). In particular, these papers highlight important features of ID systems that enable these savings, including (1) digitization, (2) a unique ID, (3) integration and interoperability, and (4) digital authentication, as shown in Table 15. For the private sector, additional features are (5) queriability, and (6) public-private partnerships (PPPs).
Table 15. ID system features that generate savings in the public sector
| Feature | Description | Key Benefits |
|---|---|---|
| Digitization | Transition from paper to digital-based systems, including of databases, credentials, data transfer, etc. |
|
| Uniqueness | Creation of a unique identifier—potentially though not necessarily via biometrics—for each person enrolled in a specific ID system. |
|
| Integration & Interoperability | Coordination and connections between different ID systems, including the ability to exchange information. |
|
| Digital Authentication | Electronic process that uses one or more factors to confirm that someone is who they claim to be |
|
Source: Adapted from ID4D Public Sector Savings and Revenue from Identification Systems
ID systems that include these features may enable a number savings and revenue-generating mechanisms, as shown in Figure 10. A thorough assessment of potential mechanisms should be conducted in the planning stage of an ID system to fully estimate the economic impact of these investments. See the public sector savings piece for a walk-though of this assessment and for country examples.
Figure 10. Savings and revenue-generation mechanisms
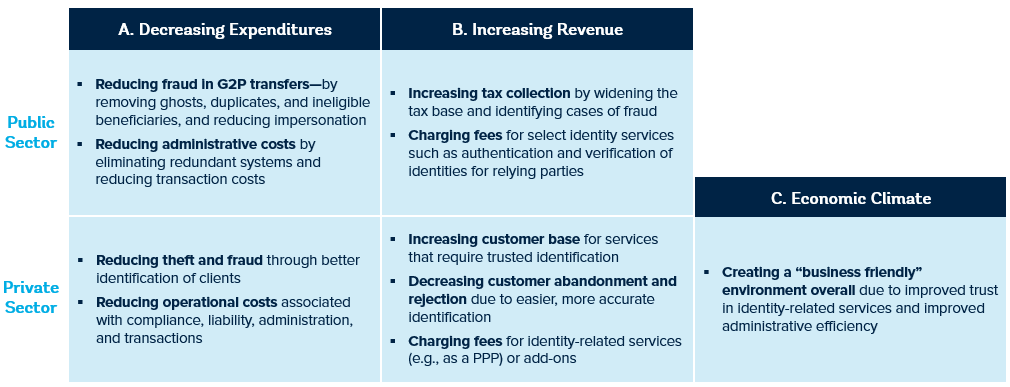
Source: Adapted from ID4D Public Sector Savings and Revenue from Identification Systems